Most brands measure social media performance by likes, shares, and follower growth. These metrics feel meaningful; they're easy to report, and they generate the kind of positive momentum that keeps stakeholders happy in a monthly review. The problem is that engagement rate has a weak relationship with revenue, and optimising for the wrong signal will cost you real money over time. If you've been asking what type of social media content actually drives sales, the answer depends far less on volume or frequency than on format, funnel stage, and the commercial intent baked into every post.
Social platforms now generate measurable purchase behaviour at scale, and the formats that win on engagement are not always the ones that close sales. Reels-based direct-response ads convert at 3.8% against 1.3% for static image ads, a near 3x gap. The data suggests this performance difference is largely attributable to format rather than budget, though creative execution and audience targeting play a role too. That contrast sets up the core argument of this piece.
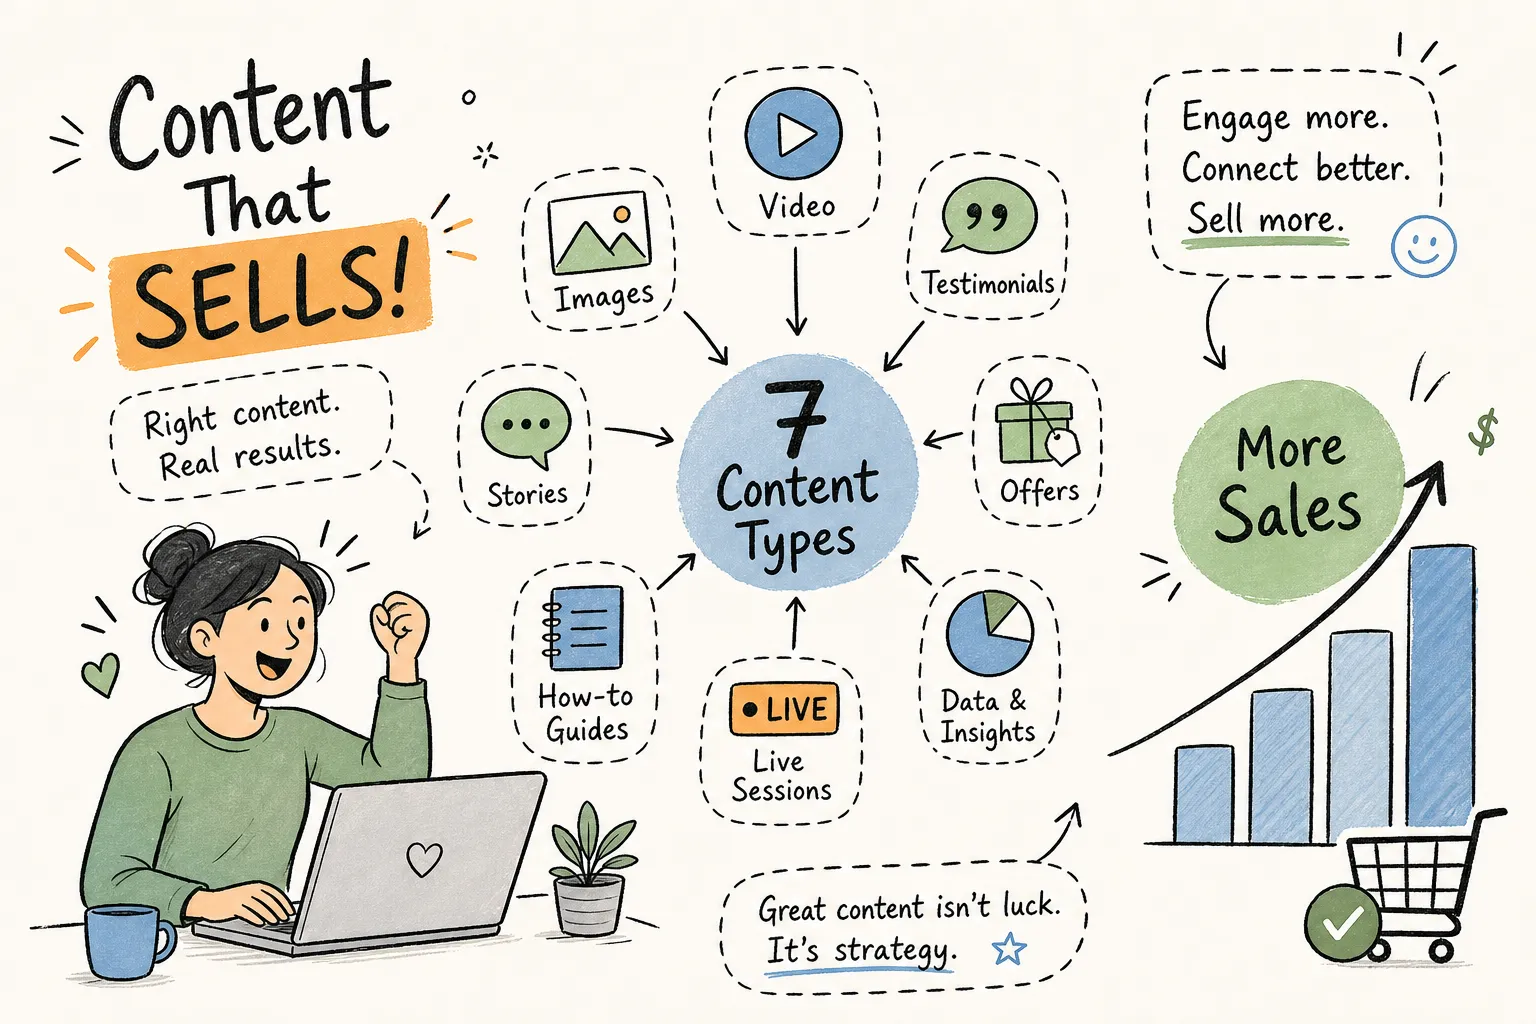
This article breaks down seven content formats by documented conversion data, not opinion. By the end, you'll know which formats to prioritise, how to write CTAs that drive action, and how to build the tracking infrastructure to measure what's working.
Why social content earns engagement but not revenue
Most social strategies are built around what the algorithm rewards, not what the customer needs to feel confident buying. High reach and strong engagement rates are not interchangeable with purchase intent. A post can go viral and produce zero sales if it lacks a clear next step, targets the wrong funnel stage, or sends traffic to a landing page that doesn't convert.
Engagement rate measures content resonance. Conversion rate measures commercial action. Both matter, but optimising purely for engagement can actively harm revenue by training your audience to consume without acting. If every post you publish is built to generate comments and shares, you're building a habit in your audience that has nothing to do with purchasing.
Content formats also carry implicit audience intent signals. Product demo content attracts decision-stage viewers who are already evaluating their options. Behind-the-scenes content builds brand familiarity at the awareness stage. Matching format to funnel stage is the foundational principle before you test anything else, it's the distinction that separates content strategies generating revenue from those generating only reports.
What type of social media content actually drives sales, the evidence
The formats below are ordered from strongest conversion evidence to weakest. Use this as a prioritisation guide, not a rigid rule. Your specific audience, offer, and creative execution will shape your own numbers, but these benchmarks give you a defensible starting hypothesis.
1. UGC: the highest documented conversion uplift
User-generated content is the most rigorously evidenced format for incremental sales lift. Product pages featuring at least 12 verified UGC images or videos convert at 6.9% versus 2.3% for brand-only pages, a 200% relative lift. A parallel A/B test across 2,000 product detail pages showed UGC outperforming brand-produced creative by a median uplift of 19% on conversion, 27% on time-on-page, and 11% on average order value. The mechanism is trust: when a real customer demonstrates a product, the buyer's objection to risk is reduced in a way that polished studio creative simply can't replicate.
2. Product demo posts: the strongest format for high-intent traffic
Product demos benchmark at a 2.9% average conversion rate for decision-stage audiences, making them the strongest format for warming traffic that's already evaluating a purchase. A demo post doesn't need to be high-production; it needs to show the product working, address the primary objection, and end with a specific CTA. Decision-stage viewers are not looking for brand storytelling at this point. They want proof that the product does what it claims.
3. Short-form video: the best reach-to-revenue efficiency at scale
Reels and TikTok short-form video deliver the strongest reach-to-revenue ratio when running paid direct-response campaigns. The 3.8% conversion rate for Reels-based ads versus 1.3% for static images is not a marginal improvement; it represents a structural advantage that tends to hold as spend increases. Short-form video also has the flexibility to function across funnel stages: a UGC-style product video can serve as a decision-stage ad, while an educational or entertainment-led Reel can drive top-of-funnel acquisition organically.
4. Carousel ads: strong for consideration and multi-product browsing
Carousel ads sit in the 2.5%, 3.5% conversion range on Instagram and carry an engagement rate of 1.36%, above both static images (1.04%) and Reels (1.24%) in feed placement. They work particularly well for higher-consideration purchases where the buyer benefits from seeing multiple product angles, a before-and-after sequence, or a step-by-step demonstration across slides. For impulse buys and lower-priced single products, a single strong image or video will often outperform a carousel.
5. Urgency-led promo posts: high conversion in the right context
Urgency-driven promotional content converts at roughly 3%, 5% in Instagram Stories format and 4%, 7% in Instagram Lives, where real-time social proof and scarcity dynamics are strongest. Placement is the critical factor: urgency language performs better in Stories and Lives than in standard feed posts, because the ephemeral format reinforces the message. "Today only" in a Stories slide lands differently than the same phrase buried in a feed caption.
6. Behind-the-scenes content: a trust builder, not a direct converter
Behind-the-scenes content rarely converts in isolation, but it meaningfully improves conversion on subsequent touchpoints by functioning as a brand familiarity driver at the awareness stage. It reduces the friction a viewer feels when they later encounter a product demo or UGC ad, think of it as the first interaction in a multi-touch sequence, not the closing argument. Measuring it purely on direct conversion will undervalue its contribution to the funnel; view-through attribution or assisted-conversion reports in GA4 give a more accurate picture of its role.
7. Shoppable posts: friction reduction with growing evidence
Shoppable posts remove the click-off-platform step, and native checkout surfaces often outperform off-platform landing pages in platform-published comparisons. Direct conversion benchmarks for shoppable posts specifically are thinner than for the formats above, but the directional evidence is clear: removing friction between intent and purchase improves conversion. If your product catalogue is set up for native shopping on Instagram or TikTok Shop, this format deserves testing as a complement to your paid campaigns.
Platform benchmarks: where each format actually performs
The format alone doesn't determine the result. Platform context shapes what's possible because audience intent, viewing behaviour, and native shopping features differ significantly across channels. A product demo on TikTok behaves differently from the same video on Instagram, even at identical production quality.
On Instagram, the full breakdown by content type looks like this: Stories link-in-bio CTR runs between 0.33% and 0.54%, with conversion around 3%, 5%; Reels deliver CTR of 0.7%, 1.4% and conversion of 2%, 4%; Carousels convert at 2.5%, 3.5%; single images at 1.5%, 2.5%; and Lives at 4%, 7%. Instagram's overall average conversion rate sits around 1.08%, which means several formats consistently beat the platform mean when executed with the right intent signal and CTA. These benchmarks aren't aspirational; they're achievable with correct format-to-funnel matching.
TikTok link-in-bio CTR benchmarks at 2%, 4%, meaningfully higher than Instagram Stories and static feed placements. On Meta combined (Facebook and Instagram), Facebook's average conversion rate sits around 1.85%, above Instagram's average, which explains why many DTC brands run TikTok for top-of-funnel acquisition and Meta for retargeting and conversion. Short-form video is the bridge format that works across both, though creative production needs to match native viewing behaviour on each platform rather than repurposing a single asset across channels.
Prioritising formats, writing CTAs and measuring results
Benchmark data is only useful if you have a decision framework to apply it. The prioritisation logic is straightforward: start with UGC and product demos for conversion campaigns, use short-form video for acquisition, and layer urgency-led Stories into retargeting windows during promotional periods. Behind-the-scenes and educational content fills the awareness stage organically. This architecture covers the full funnel without wasting budget on formats mismatched to the objective.
CTA phrasing follows the same funnel logic. Awareness-stage content should drive low-friction actions: "Save this post," "Follow for more," or "Tap the link in bio" for a content resource. Decision-stage content, including product demos, UGC, and testimonials, should drive direct purchase CTAs: "Shop now," "See it in action," or "Get your free sample." First-person phrasing frequently outperforms second-person in A/B tests: "Start my free trial" has been shown to outperform "Start your free trial." Urgency language converts better in Stories and Lives than in feed posts. These are not stylistic preferences; they're documented performance patterns.
Tracking social sales accurately requires three things working in tandem:
- Standardised UTM parameters on every social link, both organic and paid
- Conversion events firing in GA4 for purchases, form fills, and demo requests
- Platform pixels or Conversions API installed to improve match rates
For attribution modelling, use last-click for simple weekly reporting, multi-touch for budget allocation decisions, and assisted-conversion views in GA4 to understand how social contributes at stages before the final click. Lookback windows should match the sales cycle: roughly 24 days for transactional e-commerce, 90 days or longer for higher-consideration purchases.
How ClickTake Technologies builds this system for DTC clients
A structured audit is the most efficient way to identify where a current strategy is underperforming. At ClickTake Technologies, we run a systematic creative testing framework across Meta and TikTok that isolates one variable per test cycle: format, CTA phrasing, opening hook, or landing page destination. UGC and product demo assets are tested head-to-head against brand-produced creative in the same ad set to generate clean conversion data rather than directional opinion.
The framework uses the benchmarks outlined in this article as starting hypotheses, then refines against client-specific data within the first 30 days of a campaign. For e-commerce clients, the typical 90-day output is a content calendar structured around the conversion funnel: short-form UGC and product demos running as paid conversion campaigns on Meta, behind-the-scenes and educational content seeded organically on TikTok and Instagram Reels for acquisition, and urgency-led Stories running to retargeting audiences during promotional windows.
This architecture is designed for iterative improvement through creative testing rather than blanket budget increases. For brands looking to build this structure from scratch or audit an existing setup, a free 30-minute consultation with the ClickTake Technologies team is a practical starting point for identifying where your current content strategy may be leaving revenue on the table.
The bottom line: what type of social media content actually drives sales
The core hierarchy is clear: UGC and product demos lead on documented conversion uplift, short-form video wins on reach-to-revenue efficiency at scale, and carousels and urgency-led promo content serve specific funnel stages with strong supporting data. The key shift is moving from creating content that performs on-platform to creating content that converts off-platform, and that requires matching format to intent, writing CTAs with a specific payoff, and closing the measurement loop with UTMs and pixel tracking.
Social media content that actually drives sales is a system, not a collection of individual posts. Each format has a role that maps to a funnel stage, and each stage requires a different success metric. Start with UGC and product demos as your highest-conversion formats, set up tracking before you publish a single post, and build from data rather than instinct.
The brands that win on social aren't necessarily the ones posting the most or spending the most. They're the ones who treat content as a testable, measurable commercial asset, and who iterate their way to performance rather than hoping for it.
Want this work shipped for your brand? ClickTake Technologies delivers end-to-end digital marketingengagements — from strategy to execution to ongoing optimization — for ambitious brands across four regions. Book a free 30-minute consultation and we'll scope it together.