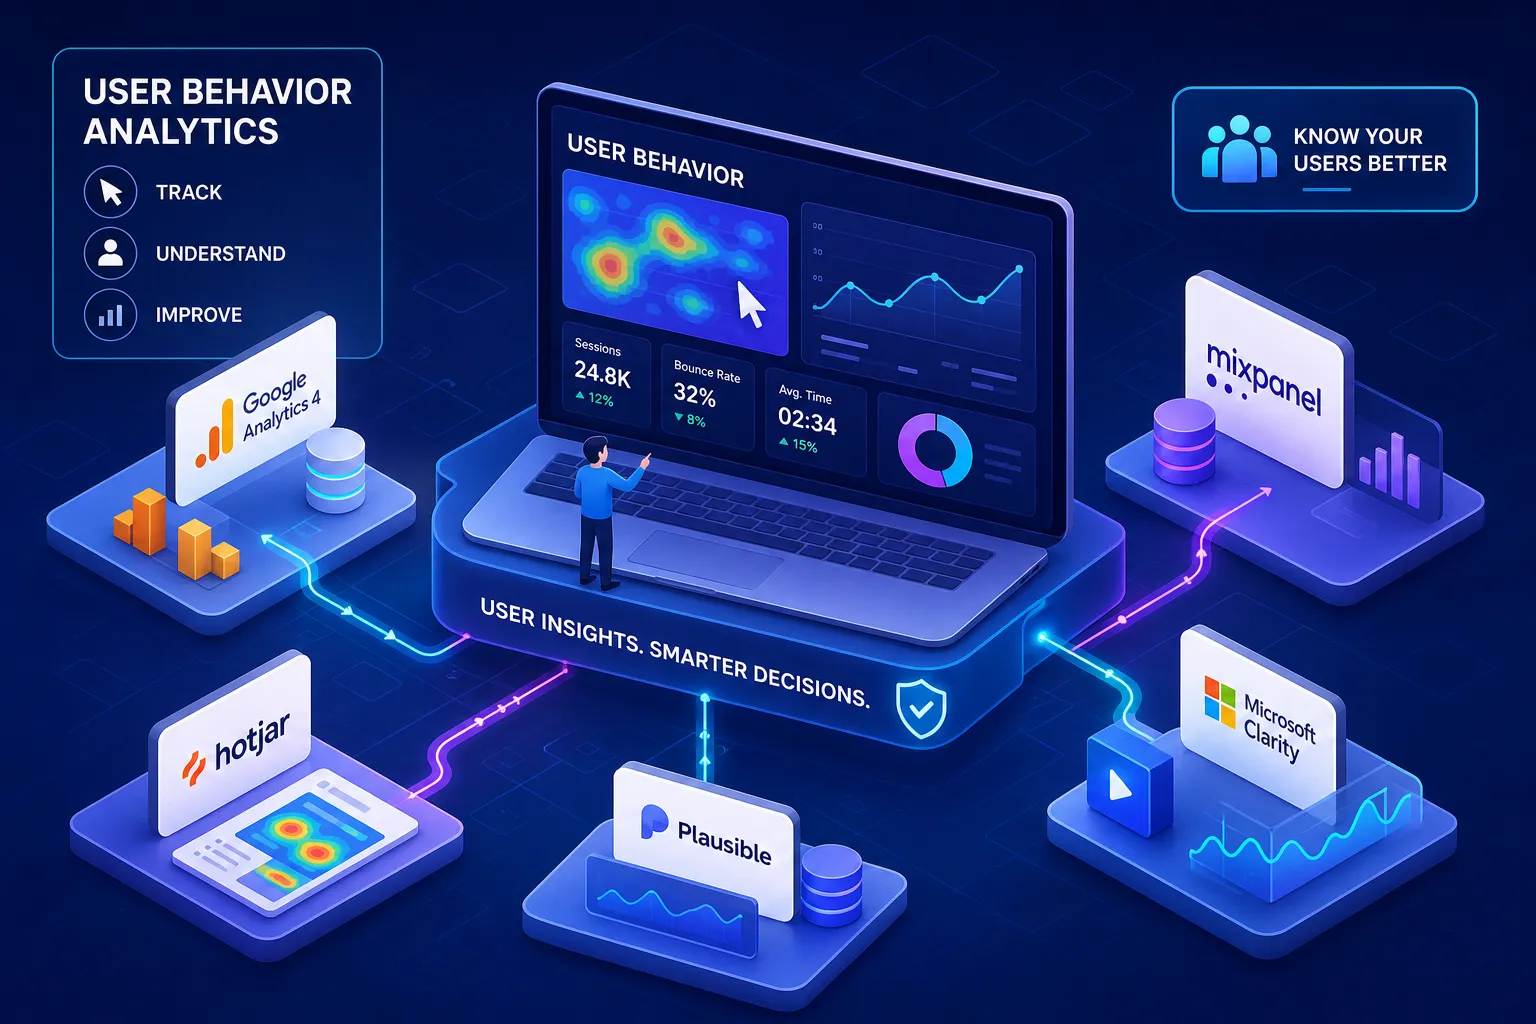
So, what are the leading platforms for website user behaviour analytics in 2026, and how do you choose between them without ending up with three overlapping subscriptions and no clear insight? In our experience working with clients across e-commerce, SaaS, and content sites, most teams install one analytics tool, set it up once, and never touch it again. Six months later, when conversion rate drops and no one can explain why, they add another tool on top. The real problem is not the tools themselves; it is the assumption that knowing how much traffic you receive is the same as understanding what users are actually doing with it.
There are two distinct intelligence layers here. Quantitative analytics, the kind GA4 provides, tells you volume: sessions, bounce rate, channel mix. Qualitative behavioural analytics reveals where users hesitate, what they click, and where they abandon. Both layers matter, but in our experience running behaviour analytics integrations across dozens of client audits at ClickTake Technologies, most teams over-invest in the first and almost entirely ignore the second. The pattern is consistent: the platform choice is rarely wrong, but the tool is almost always underused.
This article maps the main categories of user behaviour analytics, compares the strongest platforms by use case, and shows how the data connects to a broader SEO and CRO workflow.
What the main categories of website user behaviour analytics actually cover
Before evaluating specific platforms, you need to be clear about what type of analytics you are actually buying. The term "behaviour analytics" now covers at least three distinct tool categories, and conflating them leads to procuring the wrong product entirely.
Visual UX tools: heatmaps, scroll maps, and session recordings
These tools record individual user sessions and aggregate click and scroll data into visual overlays. Hotjar, Microsoft Clarity, and Mouseflow sit in this category. They answer where users go, what they click, and where they stop scrolling. Mouseflow is notable for offering seven distinct heatmap types, including attention, geo, and friction heatmaps that go well beyond the standard click and scroll views. Clarity stands out for being completely free. These are the right starting point for teams doing UX research or CRO work on a defined set of pages.
Product analytics: events, funnels, and cohort analysis
Amplitude, Mixpanel, Heap, and PostHog belong here. These platforms track discrete user actions across sessions and build quantitative models: funnel drop-off rates, retention curves, cohort behaviour over time. They answer how many users complete a given sequence and where in the funnel the break occurs. They require more upfront instrumentation than visual tools but return considerably richer analytical depth, particularly for SaaS teams making product decisions.
Enterprise experience analytics: journey intelligence at scale
FullStory, Contentsquare, and Pendo target larger organisations with complex digital products. FullStory is built on high-fidelity session replay with a searchable behavioural data model, so you can query across all sessions for specific interactions rather than watching recordings at random. Contentsquare layers revenue attribution onto zone-based heatmaps. Pendo combines analytics with in-app guidance, which makes it a popular choice for SaaS onboarding teams. These platforms carry enterprise pricing to match their capabilities.
Leading platforms for user behaviour analytics compared: which features actually matter
With the categories clear, here is how the most widely used platforms stack up across the five features that drive most procurement decisions: session recording, heatmaps, funnel analysis, cohort analysis, and A/B or experimentation integration.
Hotjar and Microsoft Clarity: the accessible entry points
Hotjar offers session recordings, heatmaps, and basic funnel analysis, with a free tier and paid plans starting around £25 to £32 per month on annual billing (based on Hotjar's published pricing at time of writing). It is the default first choice for marketing teams that need visual UX insight without significant engineering overhead. Microsoft Clarity competes directly on the basics but is entirely free, connecting with GA4 and offering genuinely useful rage-click and dead-click detection out of the box. Clarity's limitation is depth: it does not match fuller product analytics tools on funnels or cohort analysis.
FullStory, Heap, and LogRocket: enterprise-grade session intelligence
FullStory's core strength is high-fidelity session replay paired with a queryable data model. You can search across all sessions for specific behavioural patterns rather than reviewing recordings individually, which dramatically reduces the time needed to identify friction. Heap takes a different approach through autocapture: all user interactions are recorded automatically without manual event tagging, which significantly reduces implementation time. This is particularly valuable when requirements change after launch, as it allows you to define funnels retroactively. LogRocket adds developer-facing value by combining session replay with console logs, network requests, and error tracking, making it the natural choice for engineering teams debugging production issues.
Amplitude, Mixpanel, and PostHog: depth in quantitative user behaviour analytics
Amplitude is the strongest platform for retention analysis, predictive journey modelling, and cohort-based product decisions. Mixpanel is more lightweight but delivers flexible event dashboards and conversion reports with minimal setup, making it accessible for product and growth teams who want fast funnel visibility without rebuilding queries repeatedly. PostHog positions itself as the open-source all-in-one: session replay, heatmaps, funnels, feature flags, and A/B testing in a single deployable stack, with a privacy-by-design architecture that appeals strongly to teams handling sensitive user data.
Matching the right platform to your use case
Feature parity only tells part of the story. The right platform depends on the specific question you are trying to answer, not on which tool has the longest feature list. Here is how the decision typically breaks down by team type.
For e-commerce and DTC brands, the priority is understanding drop-off at product, basket, and checkout stages. Hotjar or Mouseflow handle this well at the UX research level. When you need funnel analysis tied to specific product categories or user segments, Heap or Amplitude are the stronger options. Contentsquare is worth evaluating for larger retailers where revenue-linked zone analytics justify the enterprise cost.
SaaS product teams typically need product analytics alongside activation insight. Amplitude or Mixpanel handle the quantitative side; Pendo adds in-app guidance on top if onboarding is a priority. PostHog is the strongest single-platform option for engineering-led teams that want analytics, experimentation, and session replay under one self-hosted roof without stitching together multiple tools.
For agencies and CRO teams managing multiple client accounts, the operational question is cost-per-client and ease of account switching. Hotjar's multi-site plans and Mouseflow's feature-inclusive pricing both work well at this level (see respective vendor pricing pages for current plan structures). Microsoft Clarity is a practical baseline for smaller client accounts where the budget does not support paid tooling, with the understanding that its analytical depth is limited compared with paid alternatives.
Pricing, GDPR compliance, and data privacy considerations
The cost and compliance profile of a platform should be evaluated together. Treating them as separate decisions often leads to signing a contract and then discovering the tool does not meet your data residency requirements.
On pricing, the market follows a broadly consistent pattern. Small teams typically pay between £15 and £35 per user per month on standard plans; medium-sized teams pay £50 to £100 per user per month as security, admin, and volume requirements grow; enterprise contracts are custom-quoted, generally landing between £100 and £300 per user per month before negotiated discounts. These are illustrative ranges based on publicly available vendor information and will vary by plan and negotiation. Microsoft Clarity stands out as a prominent free option in the visual analytics category, with no cap on session recordings according to its published terms. Hotjar's free tier caps recordings and pushes meaningful usage toward paid plans. PostHog offers a usage-based free tier with clearly defined thresholds before billing begins, see PostHog's pricing page for current limits.
On GDPR compliance, the practical checklist covers four items: EU data residency options, standard contractual clauses for cross-border transfers, configurable data retention periods, and a consent mode that integrates cleanly with your consent management platform. Matomo is a strong choice when data ownership and self-hosting are non-negotiable; its on-premises deployment option means no data leaves your infrastructure. PostHog's self-hosted option provides comparable control, and Piwik PRO also offers an on-prem deployment path worth evaluating. Cookieless tracking approaches are available in the market broadly, and PostHog supports privacy-focused deployment modes; for Hotjar specifically, check the current vendor documentation for cookieless configuration options, as these come with trade-offs in session accuracy that are worth understanding before enabling them in production.
How behaviour analytics data feeds directly into a technical SEO audit
This is the integration most teams miss entirely, and it is where behaviour analytics delivers some of its highest return on investment, particularly for teams already running crawl-based audits.
A standard technical SEO audit tells you what is wrong with a page: slow LCP, missing canonical tags, thin content, poor internal linking. What it cannot tell you is whether that issue is actively harming user behaviour, or whether it is an edge case on a page very few users visit. Layering session recording data on top of crawl findings closes that diagnostic gap. A page flagged for slow load time becomes a much higher priority when session data shows users bouncing within two seconds on mobile. Funnel analytics from tools like Heap or Amplitude can confirm exactly where in the journey a technical issue creates a measurable drop-off, turning a vague audit finding into a prioritised sprint task.
At ClickTake Technologies, the technical SEO audit workflow includes overlaying session recordings and heatmap data from tools like Microsoft Clarity or FullStory onto crawl and Core Web Vitals data. This is done because session evidence consistently changes client prioritisation decisions, not for reporting aesthetics. When a client can see users rage-clicking a broken filter on their category page, the fix moves to the top of the backlog rather than sitting in a recommendations document for three months. Behaviour analytics also surfaces issues that crawlers simply cannot detect: confusing navigation patterns, form fields that trigger abandonment, and above-the-fold layouts that cause users to miss the primary CTA entirely.
The most actionable audit output is a finding that links all three layers together: behaviour evidence, technical cause, and conversion impact. For example: users on the mobile product template repeatedly tap a non-interactive image carousel and abandon before the CTA; render review shows delayed JavaScript hydration and the CTA positioned below the fold; fix priority is high because the template accounts for 40 per cent of organic sessions. That kind of finding is immediately actionable, not something that requires further interpretation before it can be scheduled.
Choosing the right user behaviour analytics platform without overcomplicating the decision
The leading platforms for user behaviour analytics in 2026 are not interchangeable, and the best choice depends entirely on the question you are actually trying to answer. Visual-first teams doing UX research belong on Hotjar, Clarity, or Mouseflow. Product teams running quantitative funnel and cohort analysis need Amplitude, Mixpanel, or PostHog. Enterprise teams diagnosing complex digital journeys at scale should evaluate FullStory or Contentsquare.
On pricing, be clear-eyed: free tools get you started, but they impose caps and limitations that tend to become problems exactly when your traffic grows. On compliance, verify EU data residency, consent mode compatibility, and configurable retention periods before signing a contract. Regardless of which platform you choose, make sure it connects to your SEO and CRO workflows rather than sitting in a separate tab that only one person on the team ever opens. The data is only valuable when it changes what you build, fix, or prioritise next.
If you want a direct assessment of whether your current analytics stack is actually being used effectively, the ClickTake Technologies team offers a free 30-minute consultation to walk through your setup and identify the gaps worth closing first.
Want this work shipped for your brand? ClickTake Technologies delivers end-to-end web devengagements — from strategy to execution to ongoing optimization — for ambitious brands across four regions. Book a free 30-minute consultation and we'll scope it together.